Things to Learn
- Examine situations carefully to decide whether two quantities are proportional to each other by graphing on a coordinate plane and observing whether all the points would fall on a line that passes through the origin.
- Study examples of relationships that are not proportional as well as those that are.
Identifying Proportional and Non-Proportional Relationships in Graphs
For each problem create a table, and then graph and explain if the quantities are proportional to each other. Use the subtitle link for a Google Doc of this work.
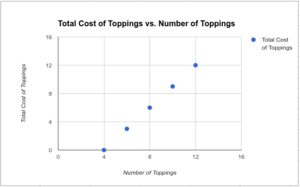
- A local frozen yogurt shop is known for their monster sundaes. The shop does not charge extra for 4 or fewer toppings but charges $3 for 6 toppings, $6 for 8, $9 for 10, and $12 for 12.
- The school library receives money for every book sold at the school’s book fair: $5 for 1 book, $10 for 2, $15 for 3, $14 for 4, and $15 for 5.
- Your uncle just bought a hybrid car and wants to take you and your siblings camping. For each hour of driving he will have only a certain amount of gasoline in the tank. The tank holds 8 gallons and after an hour 6 are left. After 4 hours, 4 are left. After 7 hours 2 are left. After 8 hours of driving the tank is empty.
- For a science project, Eli decided to study colonies of mold. He observed a piece of bread that was molding. At the end of one day he found one colony of mold. At the end of the second day he found four colonies of mold. The third day there were 9 colonies of mold. The fourth day there were 16 colonies. After five day the bread was covered with twenty-five mold colonies.
- Sally’s aunt put money in a savings account for her on the day Sally was born. The savings account pays interest for keeping her money in the bank. The ratios below represent the number of years to the amount of money in the savings account.
- After one year, the interest accumulated, and the total in Sally’s account was $312.
- After three years, the total was $340.
- After six years, the total was $380.
- After nine years, the total was $430.
- After 12 years, the total amount in Sally’s savings account was $480.
| Number of Toppings | Total Cost of Toppings |
| 4 | 0 |
| 6 | 3 |
| 8 | 6 |
| 10 | 9 |
| 12 | 12 |

Explanation:
Lesson Summary
The plotted points in a graph of a proportional relationship lie on a line that passes through the origin.
Comments are closed